Get the latest financial news, insights and expert analysis from our award-winning MoneyWeek team, to help you understand what really matters when it comes to your finances.
You are now subscribed
Your newsletter sign-up was successful
Want to add more newsletters?

Twice daily
MoneyWeek
Get the latest financial news, insights and expert analysis from our award-winning MoneyWeek team, to help you understand what really matters when it comes to your finances.

Four times a week
Look After My Bills
Sign up to our free money-saving newsletter, filled with the latest news and expert advice to help you find the best tips and deals for managing your bills. Start saving today!
In an alert entitled 'The Case for Commodities' that was published on November 9, 2003 I wrote: 'The flight out of the US dollar continues, and commodities are one of the logical safe havens in the search for undervalued tangible assets. And one of those undervalued tangible assets is gold.'
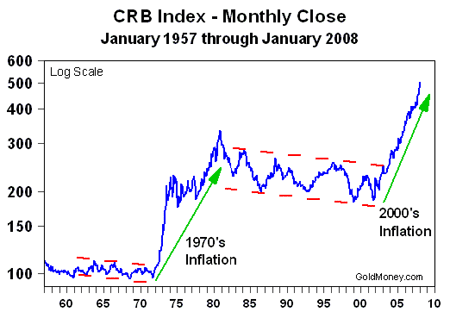
The CRB Continuing Commodity Index back then had closed at 251.03. Gold closed the same day at $383.30 per ounce ($12.323 per goldgram). The CRB Continuing Commodity Index closed yesterday at a new record high, as we can see from the following chart.
It is clear that the flight out of the dollar continues. But are commodities still a safe haven?
MoneyWeek
Subscribe to MoneyWeek today and get your first six magazine issues absolutely FREE

Sign up to Money Morning
Don't miss the latest investment and personal finances news, market analysis, plus money-saving tips with our free twice-daily newsletter
Don't miss the latest investment and personal finances news, market analysis, plus money-saving tips with our free twice-daily newsletter
In my view, the answer is a resounding yes. First, commodities are a tangible asset and therefore do not have counterparty risk.
A pound of copper, bushel of wheat or ounce of gold is not dependent upon any bank's or government's promise.

Despite the big increase in prices in recent years, commodities are still undervalued because much of the price increase results from inflation. I use a number of models to determine relative value, but here's a simple one.
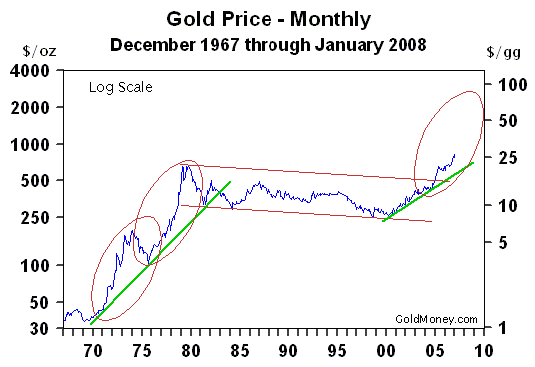
Let's start with the November 2003 prices. One ounce of gold could buy the CRB Index 1.5-times ($383.30/251.03). At yesterday's closing prices, one ounce of gold bought the CRB Index 1.8-times ($922.70/503.27), so clearly relative valuations have changed. But at the January 1980 peak, one ounce of gold bought the CRB Index nearly three times, and we are still far away from that level of relative valuation, which is one signal that gold prices have much further to rise. The following chart is also pointing to that same outcome.

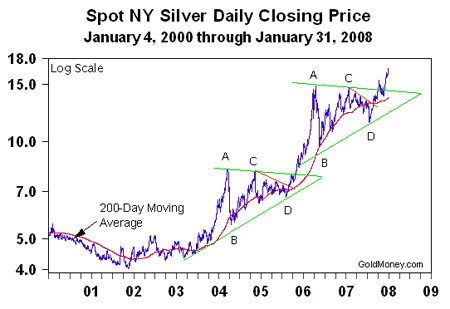
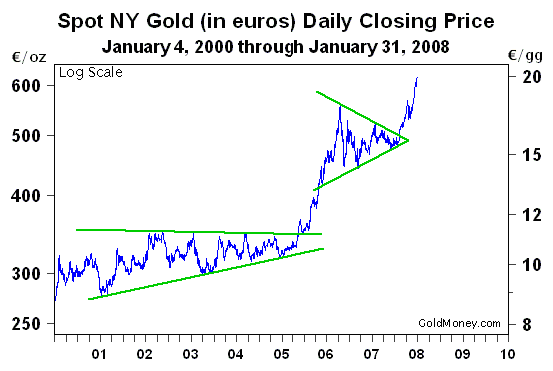
Now look at the current red oval. Gold is again pulling away from the green uptrend line. We will see in the months ahead whether history will repeat the patterns of the 1970s. I expect it will, just like history seems to be repeating in silver. The parallels between the two pennants in the following silver chart are just too obvious to ignore.


That was the year when Herstatt Bank failed in what was then West Germany, bringing the international banking system to a near standstill. A couple of months later, Franklin National Bank collapsed in New York, which at that time was the largest bank failure in US history. Slowing economic conditions (then as now) caused loans to go bad, causing losses and erosion of essential capital. Also, lines of credit not previously drawn upon during good times started being used in 1974, with the result that banks became over-leveraged (again, then as now).
Given what happened in 1974, there is one piece of advice that I can recommend. If history is any guide - and I really do believe that it is - then the current banking and credit crisis is going to get much worse before it gets better. Years of imprudent reckless lending is taking its toll on the global banking system.
There is one last point worth noting. In 1974 gold rose 72.8%, while silver jumped 84.1%.
James Turk is the Founder & Chairman of GoldMoney. He is the co-author of The Coming Collapse of the Dollar
Get the latest financial news, insights and expert analysis from our award-winning MoneyWeek team, to help you understand what really matters when it comes to your finances.
MoneyWeek is written by a team of experienced and award-winning journalists, plus expert columnists. As well as daily digital news and features, MoneyWeek also publishes a weekly magazine, covering investing and personal finance. From share tips, pensions, gold to practical investment tips - we provide a round-up to help you make money and keep it.
-
 UK interest rates live: rates held at 3.75%
The Bank of England’s Monetary Policy Committee (MPC) met today to decide UK interest rates, and voted to hold rates at their current level
-
 MoneyWeek Talks: The funds to choose in 2026
Podcast Fidelity's Tom Stevenson reveals his top three funds for 2026 for your ISA or self-invested personal pension

