What’s next for the gold price?
The price of gold has fallen well below its recent highs lately. But is this a normal, healthy correction or could it be the start of something more serious? Dominic Frisby looks back at gold's ten-year bull market to explain what's going on.
Get the latest financial news, insights and expert analysis from our award-winning MoneyWeek team, to help you understand what really matters when it comes to your finances.
You are now subscribed
Your newsletter sign-up was successful
Want to add more newsletters?

Twice daily
MoneyWeek
Get the latest financial news, insights and expert analysis from our award-winning MoneyWeek team, to help you understand what really matters when it comes to your finances.

Four times a week
Look After My Bills
Sign up to our free money-saving newsletter, filled with the latest news and expert advice to help you find the best tips and deals for managing your bills. Start saving today!
Gold has had quite a correction since the elation of early December.
From a high of $1,226 an ounce it fell as low as $1,075 about 12.5% in just over two weeks. On one day alone it fell by more than $50, one of gold's greatest daily falls ever.
So is this just a healthy mid-move correction for gold? Or the start of something more serious?
MoneyWeek
Subscribe to MoneyWeek today and get your first six magazine issues absolutely FREE

Sign up to Money Morning
Don't miss the latest investment and personal finances news, market analysis, plus money-saving tips with our free twice-daily newsletter
Don't miss the latest investment and personal finances news, market analysis, plus money-saving tips with our free twice-daily newsletter
Gold is behaving exactly according to the script
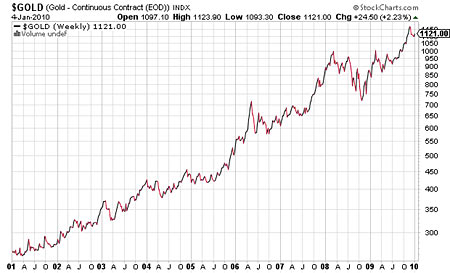
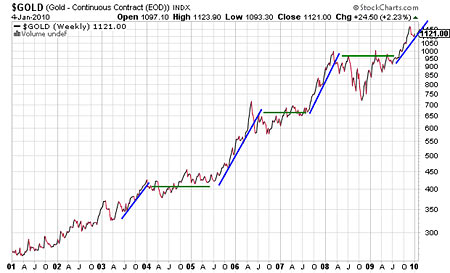
If you look back at gold's previous moves in this bull market, as I have noted many times before, you will see that gold has displayed a repeating pattern. It will move up for six to nine months, make new highs, suffer a nasty correction and then consolidate for a year to 18 months, before embarking on its next upmove.
At first glance this long-term chart looks like it has done nothing but go up for ten years.

But closer inspection reveals this repeating pattern that I describe above. Blue lines show moves up; green lines periods of consolidation.

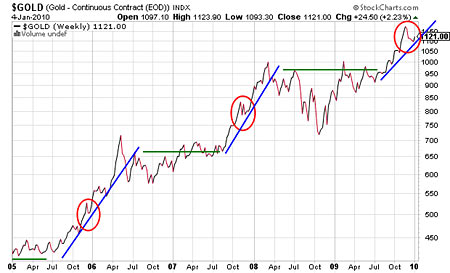
What's more, each 'blue line period' ie the up-move suffered a whopping 10% correction midway through. These may not look like much when you see them on the chart below (red circles), but for short-term traders or for anyone using leverage (perhaps spreadbetting), they would have been extremely painful periods.

In other words, gold's recent correction suggests to me that it is behaving exactly according to the script of recent years. Its autumn burst from $1,050 to $1,220 reminds me of December 2005. That month, the gold price suddenly ran up by almost $80 from $460 to $540 (how cheap does that seem now?). It then corrected down to $490. After that correction it made its way to $730.
Canadian technical analyst Ross Clark of Institutional Advisers notes: "In the bull market of the past decade corrections have typically lasted 31 to 37 trading days, comprising an initial break of 13 (+/- 2) days and a recovery rally into the 22nd day (+/- 3)."

- Why UK property prices are going to fall 50%
- When it will be time to get back in and buy up half price property
Our 'initial break' from $1,026 which ended on 21 December at $1,075 lasted 14 days. Again we are on script. The 22nd day was yesterday and gold's recovery does appear to have at least temporarily stalled yesterday. So according to these repeating patterns, we should perhaps look for another fortnight or so of correction and consolidation before gold starts to surge again and we move on up to my spring target of $1,400. Pullbacks over the coming weeks might be an opportunity to take a position for anyone who does not yet have one.
So that is one technical picture for gold. The fundamental positives that gold is no government's liability, you can't print it, it's the oldest form of wealth in the world, governments worldwide are debasing their currencies and so on remain unchanged and still loom vastly in gold's favour.
Beware: repeating patterns could be derailed by a shock to the system
But I should point out that these are just repeating patterns. There is no guarantee they work. They just often seem to. Until they don't. That might sound ridiculous, but that, in my experience, is often the nature of technical strategies. Some work well for a period a few months or a few years, maybe and then, for no apparent reason, they stop working. So you have to find a new one.
And the grim state of the global economy means that it's perfectly possible that all of these repeating patterns could be derailed by another big shock to the financial system.
For example, stock markets could suddenly turn around and crash here. Lord knows the fundamentals are bad enough. (I don't think they will, by the way, though I am betting on the resumption of the bear market). As Mike 'Mish' Shedlock of Global Economic Analysis writes, there's a long list of potential tripwires:
Global imbalances are cropping up like weeds in places like Greece, Spain, Vietnam, Iceland, Latvia, and Lithuania.
There are massive property bubbles in China, Canada, the UK, and Australia.
Japan is in a foolish fight against deflation and sinking further in debt
Commercial real estate in the US is on the verge of bringing down hundreds of regional banks.
Cities in the US are under massive pressure because of unsustainable pension plan promises.
Global terrorism is on the rise.
How long this mess hangs together without a huge crisis in a major currency is the question everyone should be asking. Sadly, most are oblivious to the widening structural cracks.
Hold on to physical gold
Bearish although this outlook is, I have to agree with it. If there is a sovereign debt crisis or a crisis in a major currency, quantitative easing and any other government interventionist economics won't matter. There'll be another panic, just like 2008. And those lovely repeating patterns in gold will stop working. Gold will fall. At least at first.
But then, in the aftermath, it will go up. A lot. So as always, hold onto your physical gold. Gold will have its ups and downs that could easily make or lose traders a lot of money. But in the long run the gold price will go a lot higher before this bull market is finally over.
Our recommended article for today
A bumpy ride ahead for the markets
This year is likely to be one of major turbulence for the markets, with big swings in both directions, says Martin Spring. Here, he looks at what we can expect in 2010.
Get the latest financial news, insights and expert analysis from our award-winning MoneyWeek team, to help you understand what really matters when it comes to your finances.
MoneyWeek is written by a team of experienced and award-winning journalists, plus expert columnists. As well as daily digital news and features, MoneyWeek also publishes a weekly magazine, covering investing and personal finance. From share tips, pensions, gold to practical investment tips - we provide a round-up to help you make money and keep it.
-
 Average UK house price reaches £300,000 for first time, Halifax says
While the average house price has topped £300k, regional disparities still remain, Halifax finds.
-
 Barings Emerging Europe trust bounces back from Russia woes
Barings Emerging Europe trust has added the Middle East and Africa to its mandate, delivering a strong recovery, says Max King

