Get the latest financial news, insights and expert analysis from our award-winning MoneyWeek team, to help you understand what really matters when it comes to your finances.
You are now subscribed
Your newsletter sign-up was successful
Want to add more newsletters?

Twice daily
MoneyWeek
Get the latest financial news, insights and expert analysis from our award-winning MoneyWeek team, to help you understand what really matters when it comes to your finances.

Four times a week
Look After My Bills
Sign up to our free money-saving newsletter, filled with the latest news and expert advice to help you find the best tips and deals for managing your bills. Start saving today!
Gold is having an ugly time of it.
Having had a strong spring, it made a "double top" at $1,260 an ounce towards the end of June. And it has spent July in an apparently inexorable decline, noticeably outperformed by other markets.
Yesterday afternoon, following a stronger-than-expected US housing report, it sold off another $20 - over 1% - in just a few minutes.
MoneyWeek
Subscribe to MoneyWeek today and get your first six magazine issues absolutely FREE

Sign up to Money Morning
Don't miss the latest investment and personal finances news, market analysis, plus money-saving tips with our free twice-daily newsletter
Don't miss the latest investment and personal finances news, market analysis, plus money-saving tips with our free twice-daily newsletter
The chart is looking tired, the buzz about the metal has subsided, interest is waning.
It could be the perfect summer set up...
Two signs that this summer could be a good time buy gold
I have long argued that gold is not so much a hedge against inflation or deflation, but a hedge against governments. Now that the Greece problem - and the contagion to Spain, Portugal and Italy - has been 'solved'; now that the Gulf of Mexico oil leak has been plugged; now that we in the UK have an efficient government bent on austerity; the world appears to have lost interest in gold.
That's fine by me.
Whether they agree with it or not, all readers will be aware of the fundamental case for gold. So I'm not going to dwell on that here. Instead, I want to draw readers' attention to some typical patterns that gold makes, as I believe a good buy-point for gold is approaching.
First, gold seems to have a couple of nasty corrections every year. These shake out the weak hands - the over-leveraged, the trend-followers and those who are less convinced about the case for owning gold. (And gold attracts a lot of slightly, shall we say, 'jittery' people).
We were overdue a correction. I said as much several times (Three reasons why gold may be due a correction). Silver was lagging, the gold stocks were lagging - the signs were there. This, in my view, is just another one of those corrections. It's too early to say for sure whether it's something worse.

- Why UK property prices are going to fall 50%
- When it will be time to get back in and buy up half price property
Second, the gold market - indeed much of the resource sector - has a tendency to go to sleep a bit in the summer. So what we are seeing is not abnormal.
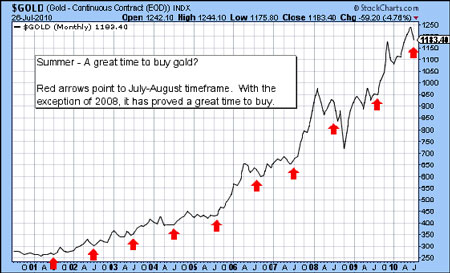
Take a look at this chart, which shows gold since 2001, when the bull market began. The red arrows mark the July-August timeframe. You can see that consistently this has marked an excellent timeframe to roll into gold and gold assets. Indeed, in many cases it has been the buy-point of the year. The exception, of course, was 2008 - but if you held on until the following spring, you were still in the money.

A good marker for entry-points is turning towards 'buy'
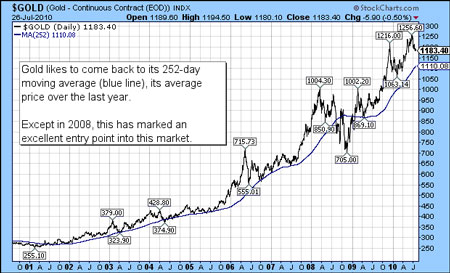
There are 252 days in the year when markets are open, so the 252-day moving average shows the average price of the previous 12 months - the 52-week moving average is its weekly equivalent. Since the bull market in gold began in 2001, gold has repeatedly returned to its 252-day moving average and bounced off it. The only exception - again - was 2008, when it smashed through it to the downside.
In this next chart, the black line shows gold and the blue line is its 252-day moving average. You can see what a consistently good marker for entry-points the latter has proved to be. (High and low prices are also marked). The 252-day moving average currently sits at $1,110 and is rising.

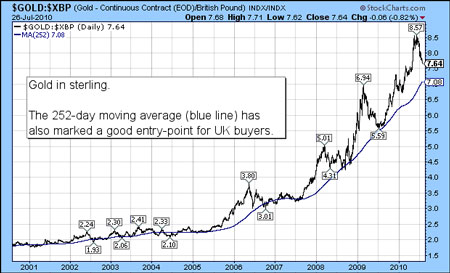
The same applies for UK-based buyers of gold. Here is a chart of gold priced in pounds. It has seen quite a decline over the past three months, as sterling has risen. But the 252-day moving average (blue line) has consistently marked a good entry point - even in 2008. This average currently sits at about £710 and is also rising. Gold costs about £765 an ounce.

So when should you buy gold?
To conclude - we know that the July-August timeframe has been a good time to buy gold in recent years. Given that in the coming weeks gold looks likely to touch, or come close to touching, its 252-day moving averages, which have proved such a consistent marker over the last ten years, I'd suggest that if gold falls another $50 or so from here, that could well mark an excellent buying opportunity for those who don't currently have, or those who want to add to, a position in gold. (And, by the way, somewhere just beneath the blue line might mark a sensible place for a stop).
Of course, it's possible that the bull market is over. I don't think it is, but that doesn't mean I'm right. I see $1,040 - the old high - as a big number for gold. If it falls beneath that, then we need to have a serious rethink.
Meanwhile, for more information on buying gold, just click here.
Our recommended article for today...
The deadly accounting trap that can destroy your investments
Support services group Connaught gave investors a nasty shock at the start of this week. But the warning signs were there on its balance sheet all along, says Bengt Saelensminde. Here's what you can learn from this disaster: The deadly accounting trap that can destroy your investments.
Get the latest financial news, insights and expert analysis from our award-winning MoneyWeek team, to help you understand what really matters when it comes to your finances.
MoneyWeek is written by a team of experienced and award-winning journalists, plus expert columnists. As well as daily digital news and features, MoneyWeek also publishes a weekly magazine, covering investing and personal finance. From share tips, pensions, gold to practical investment tips - we provide a round-up to help you make money and keep it.
-
 Adventures in Saudi Arabia
Travel The kingdom of Saudi Arabia in the Middle East is rich in undiscovered natural beauty. Get there before everybody else does, says Merryn Somerset Webb
-
 ISA fund and trust picks for every type of investor – which could work for you?
Whether you’re an ISA investor seeking reliable returns, looking to add a bit more risk to your portfolio or are new to investing, MoneyWeek asked the experts for funds and investment trusts you could consider in 2026

