Gold might look frothy – but it's not a bubble
Gold keeps setting fresh records, and is getting ever more coverage in the mainstream media. Is this a classic bubble indicator? Dominic Frisby doesn't think so. He looks at how gold's ten-year bull run compares to the investment bubbles of the past.
Get the latest financial news, insights and expert analysis from our award-winning MoneyWeek team, to help you understand what really matters when it comes to your finances.
You are now subscribed
Your newsletter sign-up was successful
Want to add more newsletters?

Twice daily
MoneyWeek
Get the latest financial news, insights and expert analysis from our award-winning MoneyWeek team, to help you understand what really matters when it comes to your finances.

Four times a week
Look After My Bills
Sign up to our free money-saving newsletter, filled with the latest news and expert advice to help you find the best tips and deals for managing your bills. Start saving today!
Within the last few weeks, gold has made it onto Radio 4's Today programme and the front pages of The Sunday Times Money section.
Even the notorious deflationist Ambrose Evans-Pritchard, who, until recently, championed government money printing in the form of quantitative easing, signed off a piece for The Telegraph last weekend with the words: "Of course gold can go higher".
When gold starts getting that kind of exposure, it's often a sign of some kind of intermediate-term top. But a bubble? I'm not so sure.
MoneyWeek
Subscribe to MoneyWeek today and get your first six magazine issues absolutely FREE

Sign up to Money Morning
Don't miss the latest investment and personal finances news, market analysis, plus money-saving tips with our free twice-daily newsletter
Don't miss the latest investment and personal finances news, market analysis, plus money-saving tips with our free twice-daily newsletter
Let's take a look at some of history's greatest bubbles and see how gold's ten-year run ranks so far.
What is a bubble?
Locked away in his hideout somewhere in eastern Australia, Nick Laird of Sharelynx has collected some of the most varied and fascinating data from financial history. He studies, he collates, he compares markets and he produces some wonderful charts.
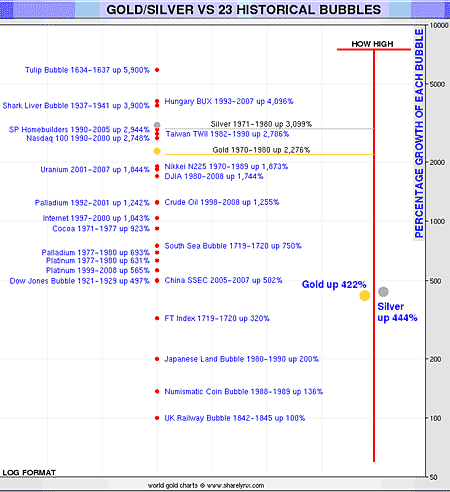
Here Nick has plotted 23 of history's greatest bubbles. There are famous ones, such as the Dutch tulip, the South Sea and the dotcom bubbles, and some not so famous. These are markets that, in his own words, "went up many hundreds of percent and then fell back hard".
'Investment bubble' is one of those terms that is so over-used that it has rather lost its meaning. For the purposes of this article, let's settle on Wikipedia's definition: a bubble is "trade in high volumes at prices that are considerably at variance with intrinsic values". That more or less ties in with Nick's definition.
It's worth spending some time casting your eye over the chart as there's a lot of fascinating history here.

This is not an entirely scientific study of bubbles by any means. It's not an exhaustive list, and the starting points are a little arbitrary and the durations variable. But it gives an idea of just how far prices across a range of asset classes can rise (usually with doubters shouting "bubble" all the way up) before collapsing.
In first place on Nick's list, we have the Dutch tulip bubble, at the peak of which in 1637, single tulip bulbs were selling for as much as ten times the annual income of a skilled craftsman. In today's money that's anything from £200,000 to £500,000 or more for a single bulb.
To my surprise, the Budapest Stock Exchange came in second, rising from the ashes of communism at around 700 in May 1993, to a peak north of 30,000 at the height of the emerging markets mania in 2007. It then fell back to 10,000 by March 2009 and now sits at around 20,000.
Special FREE report from MoneyWeek magazine: Don't be fooled - house prices will fall again!
- Why UK property prices are set to collapse by 30%
- When it will be time to get back in and buy up dirt cheap property
Of course, this shows one of the problems with measuring bubbles when does a bull market turn into an investment mania? For example, if instead of taking it from 2005-2007, if you measure China's Shanghai Stock Exchange Composite (SSEC) index over a similar period to Budapest's, from its May 1991 low at about 105 to its October 2007 peak above 6,000, you have a rise of around 6,000% over the course of 18 years. When did it turn from bull market to bubble?
When silver rose to $50 in 1980, it was up by more than 3,000% from its lows. Gold meanwhile had risen by more than 2,200%. The Japanese Nikkei had risen by more than 1,800% by 1989, at the peak of the Japanese boom. Crude oil from 1999 to 2008 rose by 1,255%.
How to tell when gold and silver are in a bubble
Getting back to the present, where are gold and silver currently trading in the great scheme of things? I would argue that both metals are still in a bull-market phase. Any mania is yet to come. Both have risen by a little more than 400% since their lows of 2001, seeing year-on-year increases of around 20%. If this is a bubble, it isn't a very big one. If it is to become a bubble of historical proportions, then we have a way to go.
How far? A 1,000% move less than the 1,250% palladium run, which ended in 2001 would take us to $2,773 gold and $45 silver. A 2,000% rise a little above the 1,850% uranium move which ended in 2007 would see gold over $5,000 and silver at $85. A 3,000% rise as per silver in 1980 would see almost $8,000 gold and $126 silver.
But how would we know when we were in genuine bubble territory? Well, in 1980, gold and silver actually went to levels above their intrinsic value. Why do I say that? Because the market value of the 260 million ounces of gold held by the USA in Fort Knox came in at $221bn, yet only some $160bn of paper money was in issue. So gold was worth 140% of American paper and US debt levels were effectively balanced.
If the market value of the gold held in Fort Knox once again exceeds the number of US dollars the US authorities have issued, then gold will be in bubble territory once again, in that it will be trading at levels above its intrinsic value.
There is, of course, no guarantee whatsoever that any such mania will happen. But history shows us what is possible once manias get underway. It also seems to suggest that the impetus built up over many years of steady bull market, such as we are seeing now, makes that final stage mania phase all the more likely.
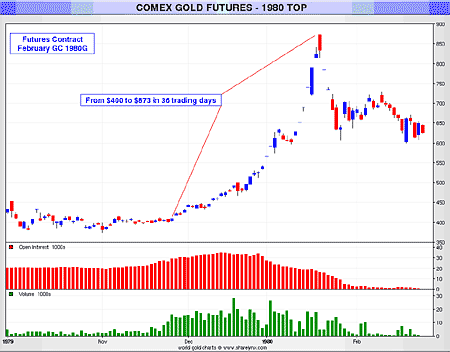
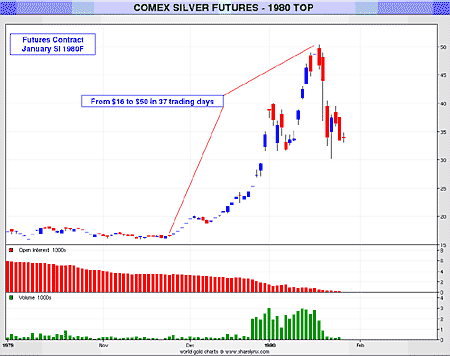
Any mania, if it happens, might look something like the following charts. These show the price action of gold and, below, silver in 1980.


Why junior mining companies are worth watching
Of course, the greatest rises within a bubble tend to be seen in the share prices of individual companies usually penny stocks as part of a larger boom. The internet start-ups in the dotcom era are a prime example. One such stock, E.digital, rose around 45,000% between January 1999 and February 2000.
This is one reason why I see so much potential in junior mining companies as this bull market in gold and silver continues to develop. And it will carry on developing for as long as governments continue to debase their currencies (and effectively blow more bubbles).
Sure, there will be further corrections along the way. And in the short-term I readily concede that gold and gold stocks are looking, shall we say, 'frothy'. But a bubble? I don't think so. Unless, that is, you subscribe to my definition: 'A bubble is a bull market in which you don't have a position'.
Our recommended article for today
The end of commission: bad news for investment trusts?
New rules banning financial advisers from taking commissions should be good for investment trusts. But they could end up having the opposite effect, says Merryn Somerset Webb.
Get the latest financial news, insights and expert analysis from our award-winning MoneyWeek team, to help you understand what really matters when it comes to your finances.
MoneyWeek is written by a team of experienced and award-winning journalists, plus expert columnists. As well as daily digital news and features, MoneyWeek also publishes a weekly magazine, covering investing and personal finance. From share tips, pensions, gold to practical investment tips - we provide a round-up to help you make money and keep it.
-
 Average UK house price reaches £300,000 for first time, Halifax says
While the average house price has topped £300k, regional disparities still remain, Halifax finds.
-
 Barings Emerging Europe trust bounces back from Russia woes
Barings Emerging Europe trust has added the Middle East and Africa to its mandate, delivering a strong recovery, says Max King

