You are now subscribed
Your newsletter sign-up was successful
Want to add more newsletters?

Twice daily
MoneyWeek
Get the latest financial news, insights and expert analysis from our award-winning MoneyWeek team, to help you understand what really matters when it comes to your finances.

Four times a week
Look After My Bills
Sign up to our free money-saving newsletter, filled with the latest news and expert advice to help you find the best tips and deals for managing your bills. Start saving today!
You may recall that in my last post on gold on 15 November, I asked the question: is gold about to stage a rally?
I laid out the case for a counter-trend rally at some stage. This was partly based on the dire sentiment picture. According to the Daily Sentiment Index (DSI), gold has become so unloved that less than 10% of advisors were bullish.
MoneyWeek
Subscribe to MoneyWeek today and get your first six magazine issues absolutely FREE

Sign up to Money Morning
Don't miss the latest investment and personal finances news, market analysis, plus money-saving tips with our free twice-daily newsletter
Don't miss the latest investment and personal finances news, market analysis, plus money-saving tips with our free twice-daily newsletter
Then, I had a short-term chart showing my tramlines and a price target:
This is clearly an A-B-C pattern and therefore counter-trend. Also, note the crossing of the major down-sloping trendline with the upper short-term tramline. I call that a hat' and is powerful resistance, since two lines of resistance meet there. This means that the trend likely remained down.
Hitting the target
So here, the odds were really stacking up in favour of a continued downtrend. The market was likely not yet ready to stage my counter-trend rally.
So, was my target hit?
I'll say. Sharp-eyed readers will see that I have slightly re-drawn my short-term tramlines. That is because after I captured the first chart, I had another touch point low to work with later on 15 November. That produced a superb lower tramline with four accurate touch points.
But with a re-drawn tramline pair, the trend was still down. Naturally, the lower tramline break was a good short entry point following the A-B-C diagnosis.
This was the situation back then. So how has the picture changed this morning?
Should I be looking for another tramline pair?
The market continued down, following the trading channel between the tramlines in textbook fashion until last Thursday. That was when the market went haywire as it toyed with my upper tramline. First it shot above my line in an overshoot, then passed down through it. It then rallied strongly up through it before dipping again but right to the line in a kiss (marked by my lower red arrow).
The market recoiled smartly from this kiss and is in a bounce this morning.
What should we make of this? Because of the zig-zag trading around my upper tramline, I might be tempted to abandon my tramline altogether. And normally, it would be a good idea to search for another tramline pair.
But it is that kiss that landed precisely on my line that retains my confidence in it.
There is no shame in being wrong
The market was breaking clear of the tramline and appeared to have made a decisive break upwards. And to show the necessity of placing a sensible protective stop on all trades, that could have been placed just under $1,240, where the market had broken the line.
As it happened, the market did fall back and stopped out the trade for a small loss. That was a low-risk trade, and a good one, since I had analysed the picture according to my trading method and had placed a close stop, also in accordance to my money management rules.
There is no disgrace in being wrong on a trade. Losing trades are part and parcel of trading in a professional manner. Just keep the losses small on your losing trades and move on.
How to find the next big reversal
Here are my Elliott-wave labels showing a long and strong wave 3 and a positive-momentum divergence at the low red bar. This momentum divergence is usually a clue that a big reversal is coming soon, especially if it appears at the end of a long trending move, as we have had here.
And right on cue, the sharp rally yesterday was a classic post-divergence move. Now, with all of this information, it is highly likely that Wednesday's low can hold.
The key for a decent rally is the pink area of resistance lurking at the previous highs. That is where an awful lot of buy stops will be lurking, having been placed there by the huge army of shorts who dominate the market.
Here is the latest commitments of traders (COT) data. Although it is over a week old, it shows the large specs have become even more bearish by a substantial margin:
| (Contracts of 100 troy ounces) | Row 0 - Cell 1 | Row 0 - Cell 2 | Row 0 - Cell 3 | Open interest: 394,432 | ||||
| Commitments | ||||||||
| 133,414 | 106,859 | 27,016 | 196,011 | 224,247 | 356,471 | 358,152 | 37,961 | 36,280 |
| Changes from 06/11/13 (Change in open interest: -3,158) | ||||||||
| -7,439 | 14,126 | -1,787 | 5,905 | -17,374 | -3,321 | -5,035 | 163 | 1,877 |
| Percent of open in terest for each category of traders | ||||||||
| 33.8 | 27.1 | 6.9 | 49.7 | 56.9 | 90.4 | 90.8 | 9.6 | 9.2 |
| Number of traders in each category (Total traders: 267) | ||||||||
| 88 | 95 | 68 | 58 | 55 | 184 | 188 | Row 8 - Cell 7 | Row 8 - Cell 8 |
Remember, the natural position is for the speculators to be massively long and the trade (commercial) to be massively short as mines hedge their forward production in Comex. This balance of long-short positions by the large and small speculators is unusual. It can therefore be considered very bearish.
The latest COT data will be released later today. And I shall be interested in seeing what the changes have been while the market has swung about my upper tramline.
-
 MoneyWeek news quiz: Can you get smart meter compensation?
Smart meter compensation rules, Premium Bonds winners, and the Bank of England’s latest base rate decision all made the news this week. How closely were you following it?
-
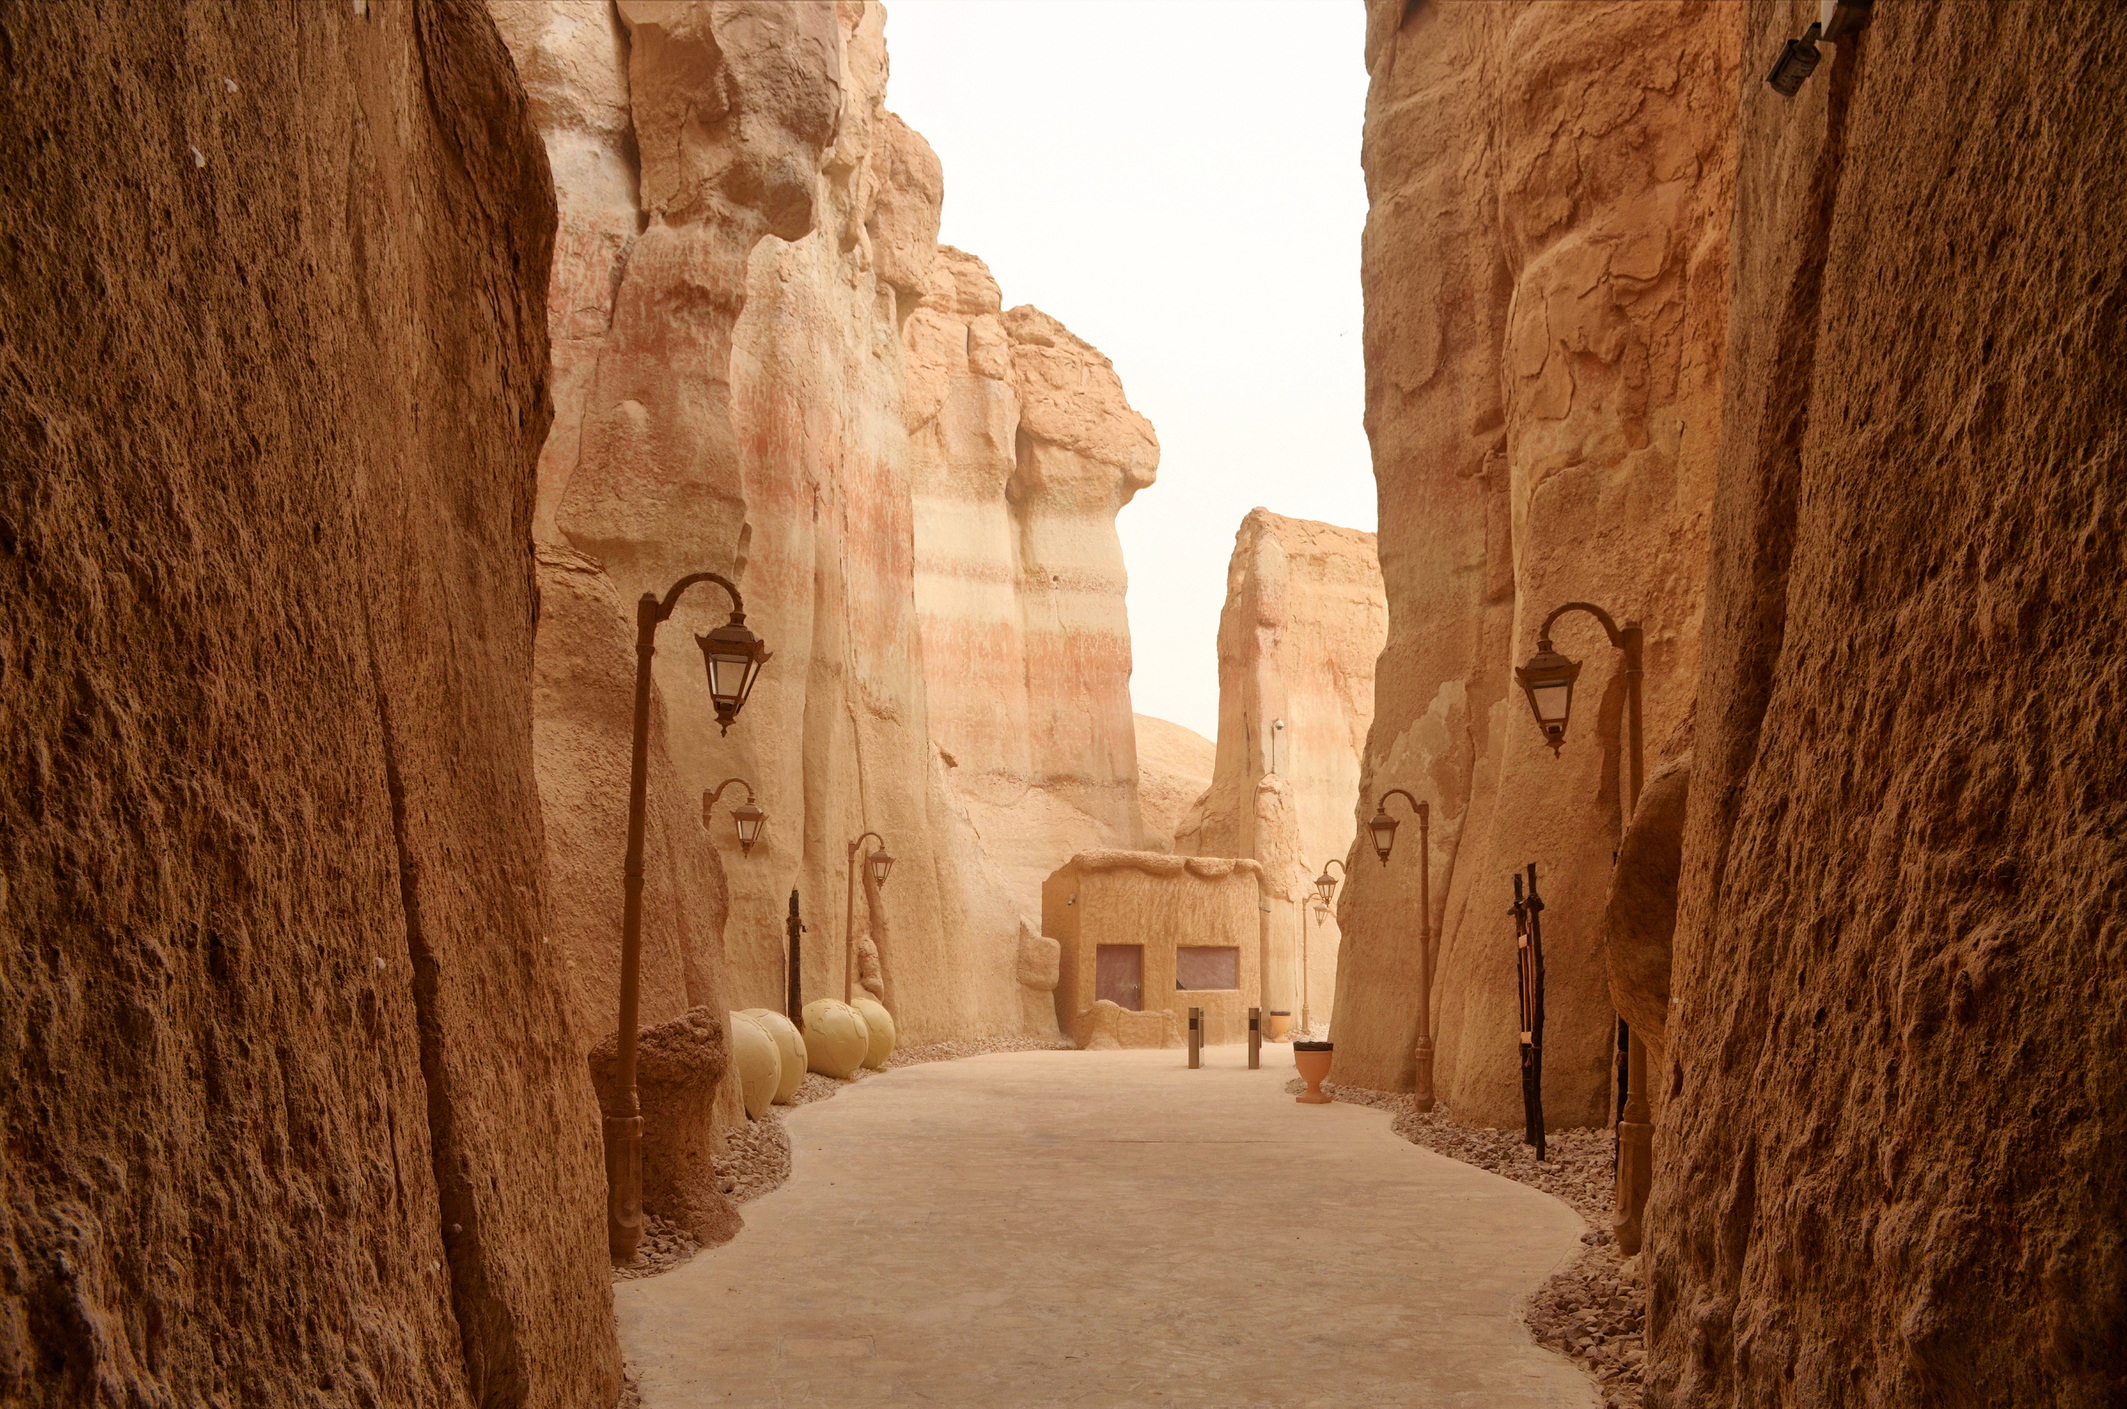 Adventures in Saudi Arabia
Travel The kingdom of Saudi Arabia in the Middle East is rich in undiscovered natural beauty. Get there before everybody else does, says Merryn Somerset Webb

