How to select tramlines in a tricky market
Placing accurate 'tramlines' on a chart can hold the key for a great trade. John C Burford explains how to do it with a trade in the tricky GBP/USD market.
Get the latest financial news, insights and expert analysis from our award-winning MoneyWeek team, to help you understand what really matters when it comes to your finances.
You are now subscribed
Your newsletter sign-up was successful
Want to add more newsletters?

Twice daily
MoneyWeek
Get the latest financial news, insights and expert analysis from our award-winning MoneyWeek team, to help you understand what really matters when it comes to your finances.

Four times a week
Look After My Bills
Sign up to our free money-saving newsletter, filled with the latest news and expert advice to help you find the best tips and deals for managing your bills. Start saving today!
Today I want to show how tramlineselection can be tricky at certain times. To illustrate this point, I have selected the GBP/USD. This market is notorious for its many spiky and zig-zaggy moves behaviour that often makes it very difficult to pinpoint accurate and best tramline placement.
Let's start with the market background.
Cable' GBP/USD has been rallying and has reached the giddy heights of $1.70. This has the media in a buzz. Here, the reason' for the recent rally has been the high growth of the UK economy (higher than any other European economy) and hints from the Bank of England that interest rates will be raised soon. It sounds so obvious, doesn't it?
MoneyWeek
Subscribe to MoneyWeek today and get your first six magazine issues absolutely FREE

Sign up to Money Morning
Don't miss the latest investment and personal finances news, market analysis, plus money-saving tips with our free twice-daily newsletter
Don't miss the latest investment and personal finances news, market analysis, plus money-saving tips with our free twice-daily newsletter
There are scare stories galore of how the rising value of the pound will destroy exports and suck in even more hot money to inflate the London house bubble'. But with interest rates on the brink of rising like Lazarus, cable must be on the path to $1.80, surely?
Where is the market in historical terms?
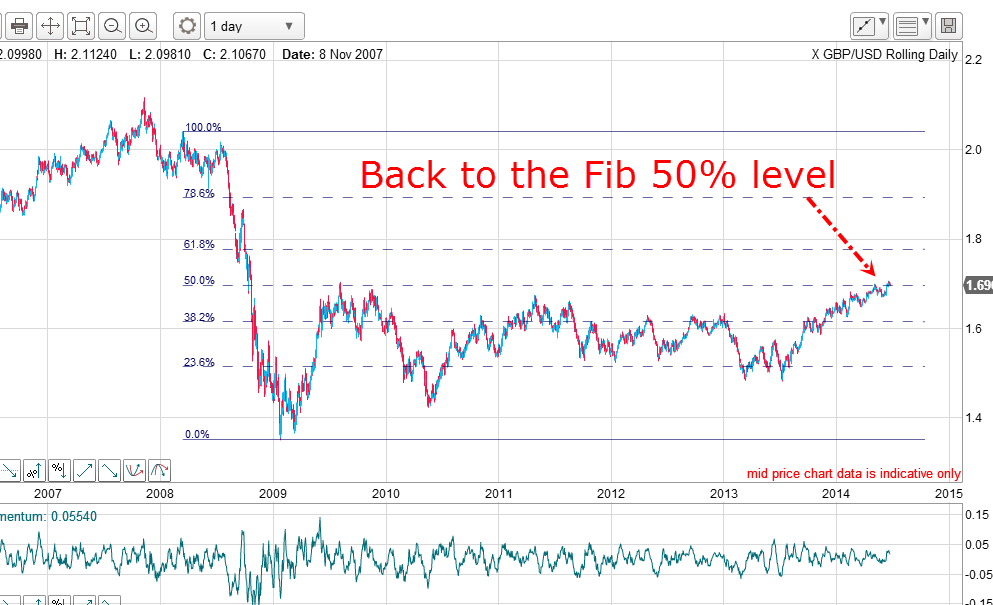
So where is the market in historical terms? Far from being high, it has only reached the Fibonacci 50% retraceof the 200709 decline where it was last trading in 2009.
The form of the decline is an impulsive five-wave patternwith a very long and exceptionally strong third wave. The recovery off the fifth wave low has all the hallmarks of a relief rally. That observation tells me to expect a resumption of the bear market at some point. And the 50% level is a great place to start!
What does the short-term picture tell us?
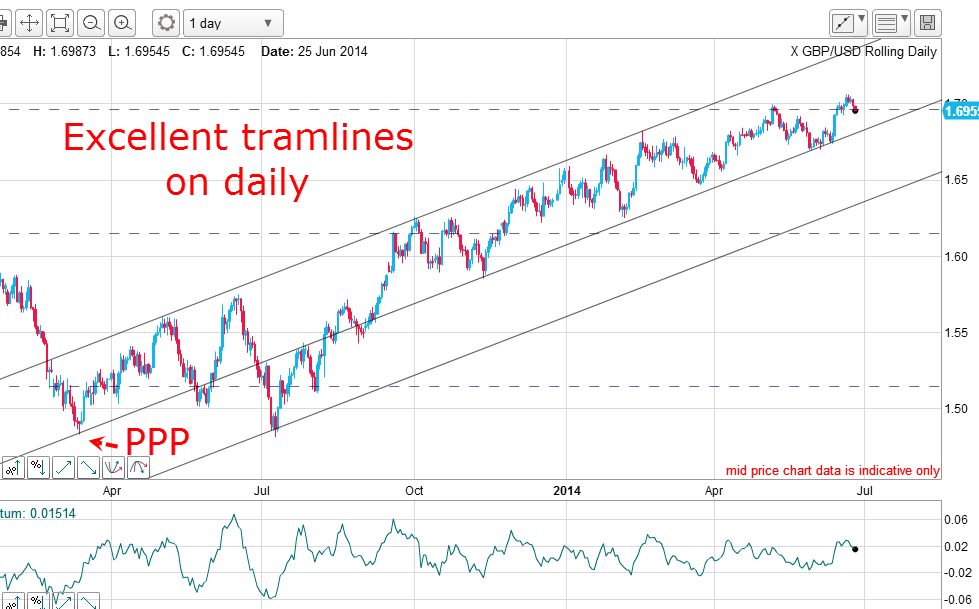
I have drawn in my centre tramline across the most recent lows and again, there are many accurate touch points. Confirming this line is solid support is the lovely prior pivot point (PPP).
That means that since last August, the market has been trading in the channel between these two tramlines. Any break out of this channel will very likely be violent.
Completing the tramline picture, I have drawn in my third lower tramline equidistant, and it very gratifyingly passes though the one major low made back in July. That will become a major target if the centre tramline can be broken.
This is a very clear-cut tramline placing and I had no great difficulty drawing the lines. There were no real alternatives that made sense. So far, so good.
What to look for when placing tramlines
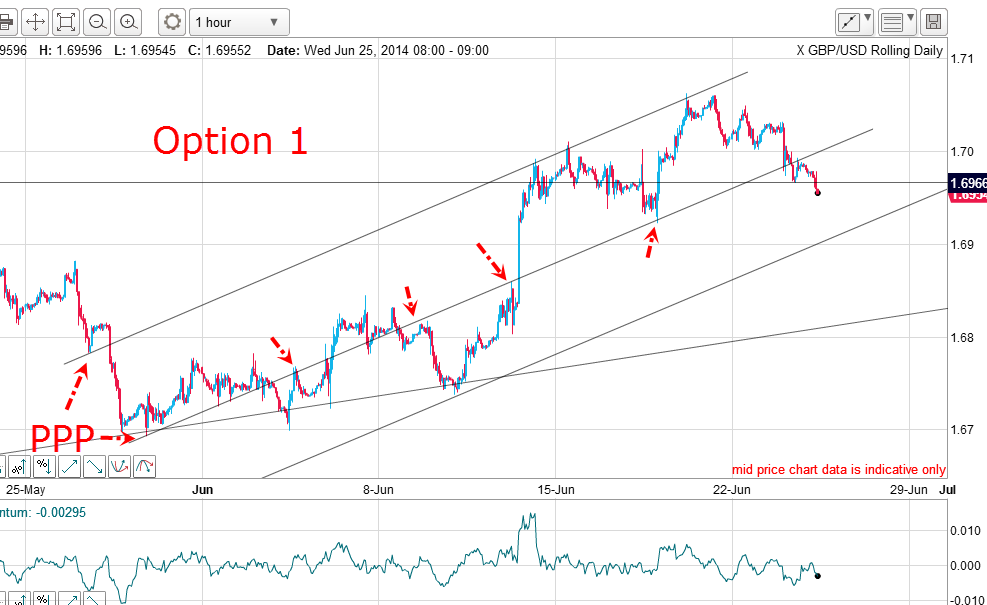
When I look for tramlines, I always want to find a good PPP on at least one of the tramlines. Here, I started with the upper line and selected my PPP and then I drew my line across the three major June highs, making it a very satisfactory line of resistance.
Then, with my parallel line tool, I selected the PPPs in late May/early June and found that it ran across the major 18 June low. Also, in the last day or so, the market has just broken this centre tramline, made a kiss and is now peeling away in a scalded cat bounce.
My third tramline nicely passes across the major 11 June low, giving me confidence that these tramlines are of excellent quality. With the centre tramline break, I can set my first target at the lower tramline.
The key to making a great trade
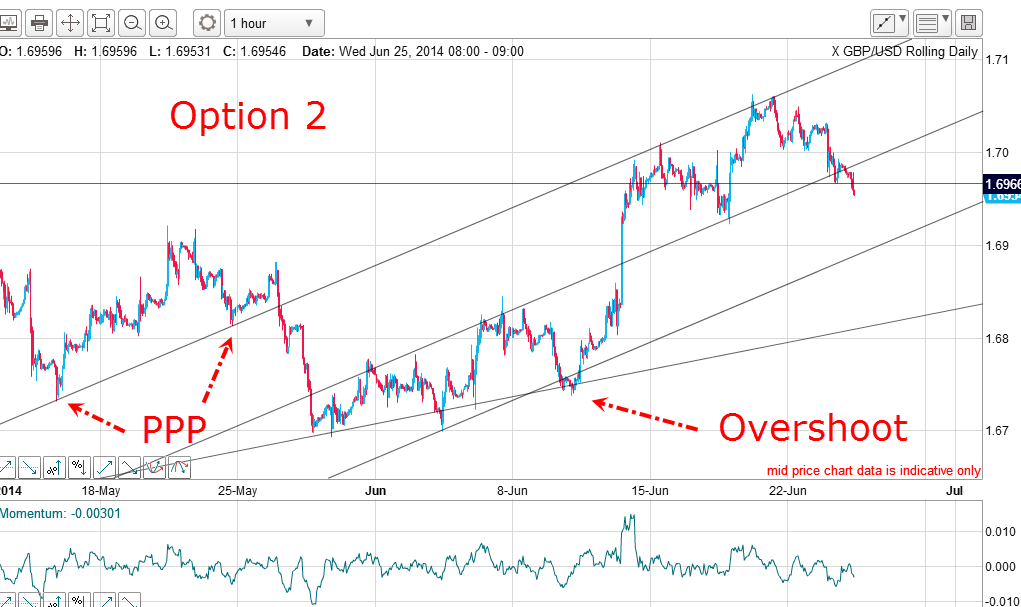
Here, I choose an earlier PPP in mid-May and also the 25 May point, and draw it across the major highs, making this a very solid line of resistance.
My centre tramline is a little more iffy', but it does have the major 18 May low as a touch point. The market has just broken below this line (as it has in option 1). My lowest tramline has one accurate touch point and an overshoot. My first target is on the lowest tramline.
Which is the best option to choose when trading?
Well, it really doesn't matter very much because we have a very recent tramline break in both cases. The only real difference is the slightly different first targets.
But there was an earlier tramline set-up that gave the game away:
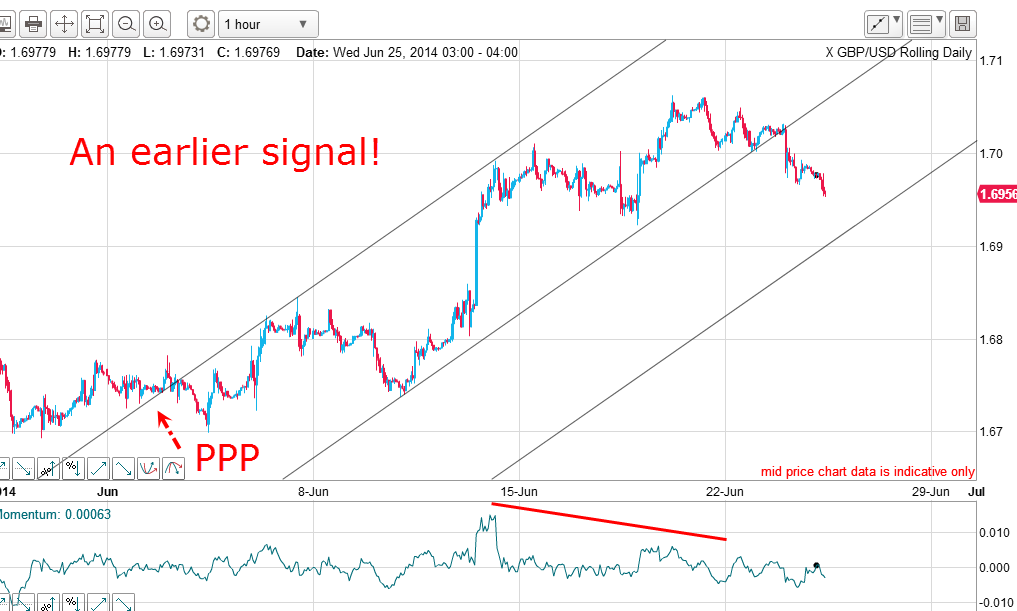
I have drawn a higher-sloping tramline set off the most recent highs/lows and when the centre tramline was broken yesterday, that was a shorting signal. The later signals in options 1 and 2 came as confirmation. Note the very large negative momentum divergencegoing into Friday's 1.7050 high a sure give-away that buying was drying up.
The lesson: when you think you have a great tramline set-up, keep looking for other equally valid sets they may hold the key for a great trade.
Get the latest financial news, insights and expert analysis from our award-winning MoneyWeek team, to help you understand what really matters when it comes to your finances.
John is is a British-born lapsed PhD physicist, who previously worked for Nasa on the Mars exploration team. He is a former commodity trading advisor with the US Commodities Futures Trading Commission, and worked in a boutique futures house in California in the 1980s.
He was a partner in one of the first futures newsletter advisory services, based in Washington DC, specialising in pork bellies and currencies. John is primarily a chart-reading trader, having cut his trading teeth in the days before PCs.
As well as his work in the financial world, he has launched, run and sold several 'real' businesses producing 'real' products.
-
 Average UK house price reaches £300,000 for first time, Halifax says
While the average house price has topped £300k, regional disparities still remain, Halifax finds.
-
 Barings Emerging Europe trust bounces back from Russia woes
Barings Emerging Europe trust has added the Middle East and Africa to its mandate, delivering a strong recovery, says Max King