Is gold cheap relative to equities?
Dominic Frisby looks at the Dow-gold ratio and explains why gold is starting to appear inexpensive compared to equities.


You are now subscribed
Your newsletter sign-up was successful
Want to add more newsletters?

Twice daily
MoneyWeek
Get the latest financial news, insights and expert analysis from our award-winning MoneyWeek team, to help you understand what really matters when it comes to your finances.

Four times a week
Look After My Bills
Sign up to our free money-saving newsletter, filled with the latest news and expert advice to help you find the best tips and deals for managing your bills. Start saving today!
I thought today I would check in on some charts that I haven’t looked at in a very long time.
That is the Dow-gold ratio - the long-term ratio between the price of gold and the value of 30 of the most prominent companies in the US, aka the Dow Jones Industrial Average.
MoneyWeek
Subscribe to MoneyWeek today and get your first six magazine issues absolutely FREE

Sign up to Money Morning
Don't miss the latest investment and personal finances news, market analysis, plus money-saving tips with our free twice-daily newsletter
Don't miss the latest investment and personal finances news, market analysis, plus money-saving tips with our free twice-daily newsletter
Effectively, you are measuring stocks in money that hasn’t been debased. There are many who argue that the gold price is suppressed, but let us put such thoughts to one side and accept that, even if it has, gold’s value - its purchasing power - has preserved way better than the US dollar’s, or indeed any national currency.
In this instance, gold is a better unit of account, and the act of valuing stock prices in gold can tell you, quite quickly, which asset is cheap and which is expensive.
So here, courtesy of Nick Laird over at goldchartsrus, is the Dow-gold ratio since, get this, 1800.
A major change in the evolution of money
There is a lot to take in here.
The period from 1800 to 1913 is of considerable historical interest, but it is fairly irrelevant to use as investors. Gold was money in the 19th century and the US stock market was young.
Nevertheless we observe how the value of America’s companies grew incrementally over the course of that century, but in a relatively measured way. There was not the volatility that came with the post 1913 era of central banking.
When the black line is rising it means that stocks are rising in price, relative to gold.
220 years- Dow/Gold Ratio

Turning next to the post 1913 era. Nick has drawn a vertical red line at 1913 because that is when the US Federal Reserve Bank was formed. The following year the UK, France and Germany all abandoned their gold standards to print money to pay for World War One.
The period saw a major sea change in the evolution of money and banking.
You can see that there were three major highs - in 1929, in 1971 and in 2000. Again these were all years that saw major financial turning points. 1929 was the top of the stock market before the Great Crash. 1971 was the year President Nixon took the US off the gold standard. And 2000 was the year DotCom peaked while gold came to the end of a 20-year bear market.
Also notable are the years 1932 to 1933 - the low in stocks in the Great Depression and the time President Roosevelt confiscated Americans’ gold and then devalued the dollar.
And 1980 too. That was the year that the great gold bull market of the 1970s came to end. Gold spiked with the Iranian hostage crisis to $850/oz and, with Fed chief Paul Volker’s raising the Fed funds rate to 20%, the era of inflation came to an end and the stage was set for the next bull market in stocks.
Here is the last 120 years in close up.
120 Years - Dow/Gold Ratio

With the Dow today at 33,800 and gold at $1,790/oz it takes 19 ounces to buy the Dow. So gold is right in the middle of the range. It is neither expensive nor cheap. The same could be said of stocks.
There are many who argue that the Dow-gold ratio is going back to 1, as it did in 1980. That return could take many forms. There could be an extraordinary bull market in gold, inflation in the US dollar and stocks could simply remain flat. In such a scenario gold would have to go to $33,000/oz.
I don’t think that is going to happen, unless the US suddenly decides it is going to settle its debts with its gold and revalues the price upwards. Unlikely.
I suppose it’s possible that some deflationary panic, a war or a global pandemic, could send stocks tumbling by 50%, while gold itself goes up 10 times. Again unlikely. But these are the kind of scenarios we would need for that ratio to go back to 1.
I just don’t think it’s realistic. It might have been normal in the 19th century, but not today.
On the other hand, a runaway bull market in stocks could see the Dow double over the next three years while the world becomes even less interested in the analogue asset that is gold sending the price back to $1,300.
In that kind of scenario you would have a Dow-gold ratio at 50.
It would be above and beyond the green confidence band on the chart at extremities, but I have to say I would have thought a Dow-gold ratio at 50 is more likely than at one.
But based on the chart above, gold is probably a sell below 10 on the ratio.
Asset allocation for the next market cycle
Alternatively, here is the S&P 500-gold ratio.
With the S&P currently at 4,120 and gold at $1,790/oz that ratio currently stands at 2.3.
100 Years S&P 500/Gold Ratio

This a ratio that could easily go to one. If the S&P comes off a little bit, say 25% to 3,000 while gold has a big run to $3,000 - which is not such an impossible number - the S&P-gold ratio will hit one. It’s unlikely, but not impossible.
Similarly the S&P could go to 7,000 or more as gold falls to $1,500. Then you’ve got an S&P-gold ratio at 5. Not such an impossibility.
Stocks have been rising relative to gold since 2011, when gold last peaked. In the last three years they’ve wobbled a bit.
Where’s that one headed? One or five? Or do we stay where we are around 2?
It’s a big call. But it’s an important one to get right, as you allocate assets for the next cycle.
And if you happen to be in Edinburgh this week, please come and see my show How Heavy?, a lecture with funny bits about weights and measures. It’s running at the Fringe until Sunday. You can get tickets here.

-
 ISA fund and trust picks for every type of investor – which could work for you?
Whether you’re an ISA investor seeking reliable returns, looking to add a bit more risk to your portfolio or are new to investing, MoneyWeek asked the experts for funds and investment trusts you could consider in 2026
-
 The most popular fund sectors of 2025 as investor outflows continue
It was another difficult year for fund inflows but there are signs that investors are returning to the financial markets


-
 'Investors should brace for Trump’s great inflation'
Opinion Donald Trump's actions against Federal Reserve chair Jerome Powell will likely stoke rising prices. Investors should prepare for the worst, says Matthew Lynn
-
 The challenge with currency hedging
A weaker dollar will make currency hedges more appealing, but volatile rates may complicate the results
-
 What's behind the big shift in Japanese government bonds?
Rising long-term Japanese government bond yields point to growing nervousness about the future – and not just inflation
-
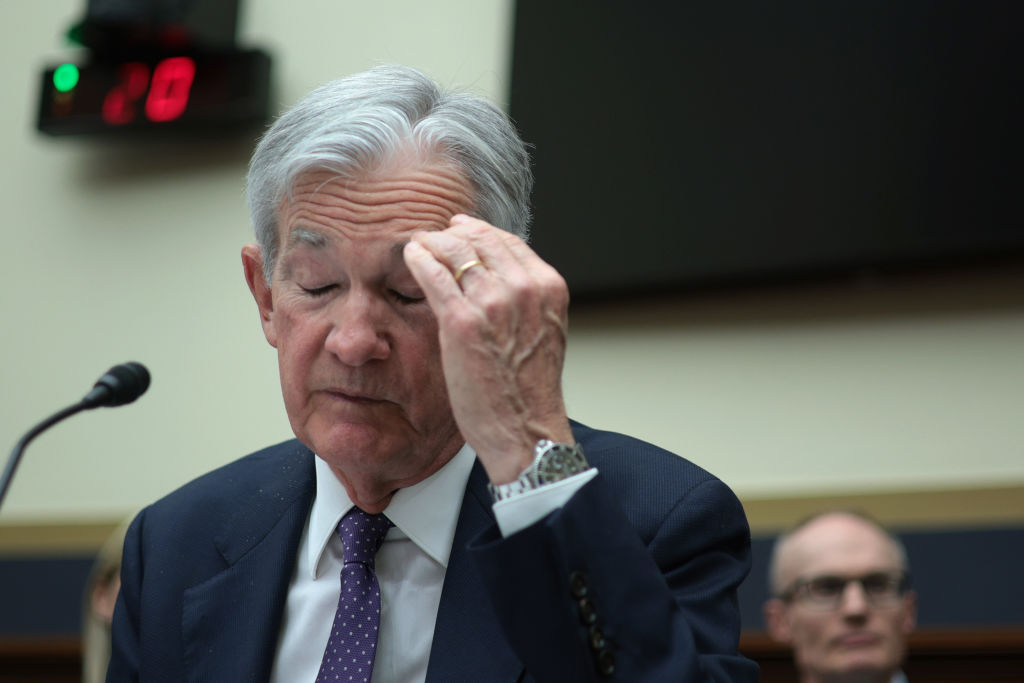 Can Donald Trump fire Jay Powell – and what do his threats mean for investors?
Donald Trump has been vocal in his criticism of Jerome "Jay" Powell, chairman of the Federal Reserve. What do his threats to fire him mean for markets and investors?
-
 Freetrade’s new easy-access funds aim to beat top savings rates
Freetrade has launched an easy-access exchange traded fund (ETF) range - here’s how the ETFs work and how they compare to the savings market
-
 Go for value stocks to insure your portfolio against shocks, says James Montier
Interview James Montier, at investment management group GMO, discusses value stocks and slow-burn Minsky moments with MoneyWeek.
-
 Halifax: House price slump continues as prices slide for the sixth consecutive month
UK house prices fell again in September as buyers returned, but the slowdown was not as fast as anticipated, latest Halifax data shows. Where are house prices falling the most?
-
 Rents hit a record high - but is the opportunity for buy-to-let investors still strong?
UK rent prices have hit a record high with the average hitting over £1,200 a month says Rightmove. Are there still opportunities in buy-to-let?


