What the price of gold reveals about UK house prices
As governments debase their currencies, paper money becomes an ever less reliable measure of an asset's true value. For that, we must use a genuine store of wealth: gold. Dominic Frisby looks at the real price of Britain's houses, and where they might go from here.

You are now subscribed
Your newsletter sign-up was successful
Want to add more newsletters?

Twice daily
MoneyWeek
Get the latest financial news, insights and expert analysis from our award-winning MoneyWeek team, to help you understand what really matters when it comes to your finances.

Four times a week
Look After My Bills
Sign up to our free money-saving newsletter, filled with the latest news and expert advice to help you find the best tips and deals for managing your bills. Start saving today!
var WRInitTime=(new Date()).getTime();
What's the most controversial topic we've ever tackled? You'd think it might be something about exploiting rising food prices. Or bankers' bonuses. Or even vice stocks.
I doubt any of you would have guessed: "the ratio of gold and silver to house prices". Yet that is the subject that holds the record for reader comments by a long chalk.
MoneyWeek
Subscribe to MoneyWeek today and get your first six magazine issues absolutely FREE

Sign up to Money Morning
Don't miss the latest investment and personal finances news, market analysis, plus money-saving tips with our free twice-daily newsletter
Don't miss the latest investment and personal finances news, market analysis, plus money-saving tips with our free twice-daily newsletter
And today I'd like to update you on that topic.
The best way to measure house prices
Let's kick off with a stat that I find amazing. Did you know that if you had sold your average British house in late 2004 and bought silver just regular bars of silver you could now sell that silver and buy 5.5 average British houses?
As we all know, money seems to buy you less and less each year the above statistic really brings this home. This is because we operate under a system of 'fiat' (from the Latin, 'let it be done') money and credit. Churchill described it as money 'by government edict'. In other words, it is the law that what we use as money be money. Without that legal backing, modern money would be just a meaningless computer digit or piece of paper.
The problem is that, for all the 'bond vigilantes', and for all the regulation and whatever other means there are of imposing discipline, governments and central banks, however well intentioned, find ways of debasing the currency. There are so many ways of doing so, from deficit spending and inflation to artificially compressed interest rates to quantitative easing. It's just too tempting, as it's usually the easiest way out of a bind.
So I prefer to look at investment markets whether it's the Dow Jones index, the oil price, or the UK housing market valued in terms of a store of wealth that governments can't debase so easily. That store for me, is gold and silver. And given that more than a few people have moved their wealth out of real estate and into precious metals, the comparison between the two is, in my view, an extremely important ratio.
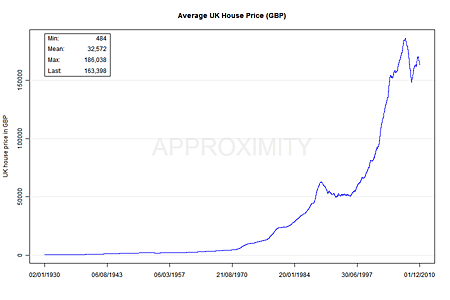
First, to put things into perspective, here is a long-term chart of UK house prices in pounds sterling. It is an apparently-never-ending upward slope. It's why the attitude that 'you can't go wrong with bricks and mortar' is embedded in our psyche. (Really, of course, this is just a manifestation of the never-ending decline in the purchasing power of sterling).
My sincere thanks go to Tom Fischer, professor of financial mathematics at the University of Wuerzburg, for producing these charts for me.
What the gold price reveals about house prices
Now we look at a long-term chart of UK house prices measured in gold, a store of wealth that governments, for all their hard work, find considerably harder to debase. It's a rather different picture.
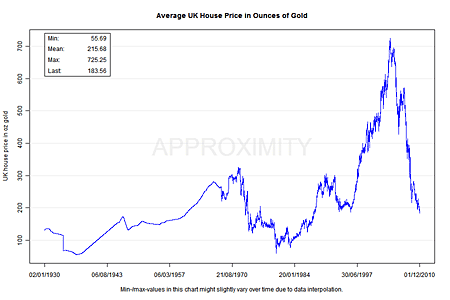
You can see that, until the late 1990s, UK house prices traded in a range between 50 ounces for the average UK house (1930s and 1980) and 300 ounces (early 1970s, late 1980s).
In late 2004, with gold at around $400 an ounce and the average UK house price just above £150,000 (below where they are now) that ratio hit an unprecedented high. It took more than 700 ounces of gold to buy the average UK house.
With gold now around $1,400 (about £900 per ounce) and house prices in the £165,000 zone, the ratio has broken through the 200 ounces barrier and sits at 183. Indeed, measured in gold, UK housing has already fallen below the lows of the early to mid-1990s.
Yet for all the falls since 2004, at current prices (183 gold ounces) we are still above the long-term average which is around 150 ounces. I suspect we'll go well below that.
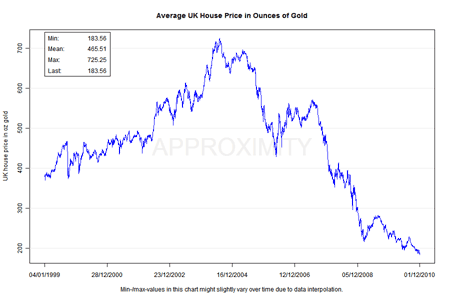
Here is the chart in close-up, since 1999. That is what a real, grinding bear market the sort of deflation that governments and central banks are now printing money to avoid looks like.
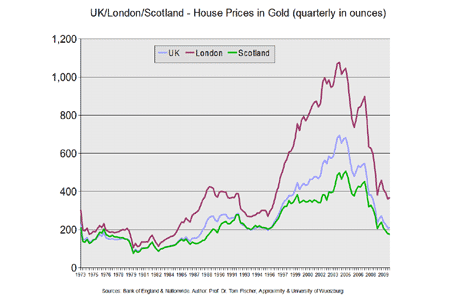
For those based in London or Scotland, here's a chart of your neighbourhood priced in gold. I see 200 gold ounces (currently £180,000) for the average London home (currently costing c. £340,000) as a very realistic target. We now sit at 380 ounces.
How UK house prices compare to silver
The more adventurous some might say impetuous investors did not sell real estate and buy gold, however. They bought the more volatile silver. Here is a long-term chart of UK house prices measured in silver.
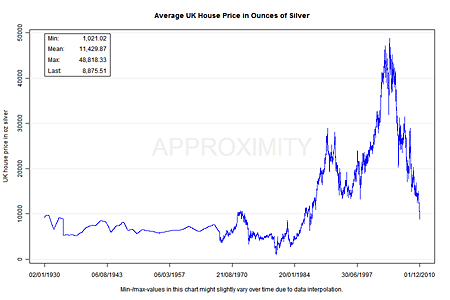
In 2004, when silver was trading at around $6 an ounce, it took almost 50,000 ounces to buy the average UK home. But in 1980, when silver went to $50, you could buy the average UK home for just 1,000 ounces. (Today 1,000 ounces of silver would cost you just £20,000).
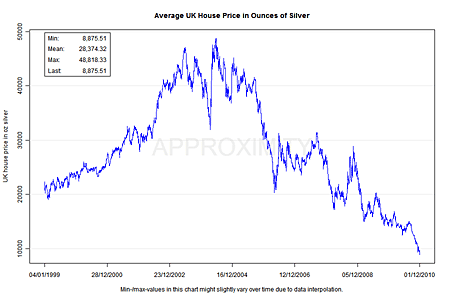
Here is that silver chart in close-up, since 1999. As you can see the ratio has slipped below 10,000 ounces. (The long-term average is in the 6-8,000 ounce range).
So what now?
Well, I remain a bull on precious metals and a bear on housing. The trade is maturing, but the run is not over. Long-term holders of gold and silver should sit tight.
Silver, and the leading silver stocks, have gone absolutely bananas of late and there are lots of arguments for those with shorter time horizons to take some money off the table here and await a correction. But there are just as many arguments from short squeezes on the Comex, to supply shortages, to government money printing for higher prices too.
Meanwhile, there are plenty of reasons from unbelievably strict lending criteria to the threat of rising unemployment that augur serious falls even in nominal UK house prices.
Now that would be a surprise.
Our recommended article for today
Why you need to keep some cash at hand
Most investors are convinced by the inflation argument. But Bengt Saelensminde isn't so sure. The threat of deflation hasn't gone away, he says. Here, he explains why keeping some cash handy could leave you with the last laugh.
if(document.location.protocol!='https:') document.write(unescape("%3Cscript%20src='https://s.clicktale.net/WRb6.js'%20type='text/javascript'%3E%3C/script%3E"));if(typeof ClickTale=='function') ClickTale(10960,1,"www03");

-
 ISA fund and trust picks for every type of investor – which could work for you?
Whether you’re an ISA investor seeking reliable returns, looking to add a bit more risk to your portfolio or are new to investing, MoneyWeek asked the experts for funds and investment trusts you could consider in 2026
-
 The most popular fund sectors of 2025 as investor outflows continue
It was another difficult year for fund inflows but there are signs that investors are returning to the financial markets

