Fog settles over the Dow
The Dow is painting a tricky picture in the charts. John C Burford uses his trading methods to weigh up his options.
Today, I will cover the Dow partly because I haven't done so for a while and also because there are some interesting alternative chart patterns forming. I still have the problem of deciding which wave count will prevail from the several equally-plausible options presented today.
For some time, I have not had a firm view on direction because of competing wave counts. This is the most bullish long-term count I have:
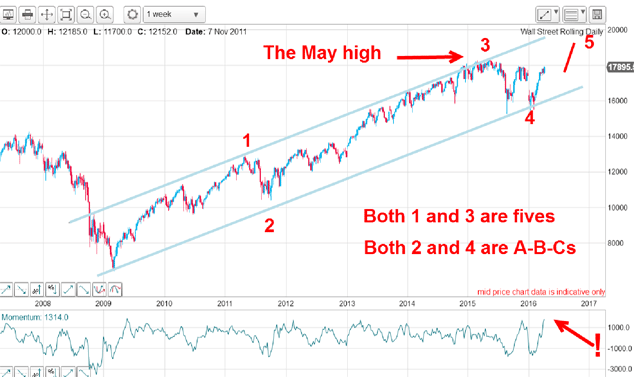
I have a good long-range tramline pair working with the upper line sporting several excellent accurate touch points. The first is the late 2008 high, the second is my wave 1 high and there are several lying along the highs of wave 3.
Subscribe to MoneyWeek
Subscribe to MoneyWeek today and get your first six magazine issues absolutely FREE
Sign up to Money Morning
Don't miss the latest investment and personal finances news, market analysis, plus money-saving tips with our free twice-daily newsletter
Don't miss the latest investment and personal finances news, market analysis, plus money-saving tips with our free twice-daily newsletter
Waves 2 and 4 are both typical threes and waves 1 and 3 are fives. This count obeys all of the Elliott rules and guidelines and so must be considered viable with the end result being the current wave 5 should move up above the May high of wave 3 into a new all-time high. After that, the market should decline in a very dramatic series of collapses.
Let me zoom in on waves 4 and 5 now:
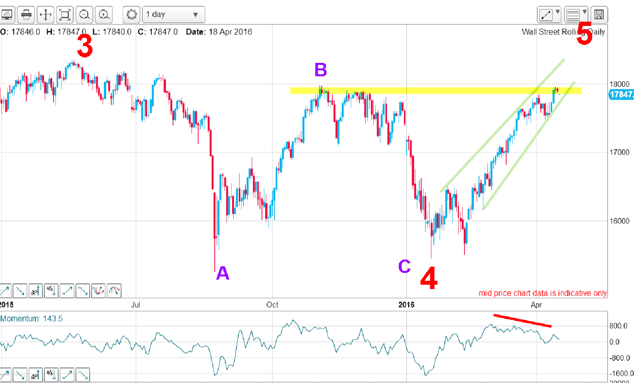
Wave 4 has that A-B-C corrective look and wave 5 is in a minor third wave up. And there is a solid momentum divergence at these levels. Here it is in close-up:
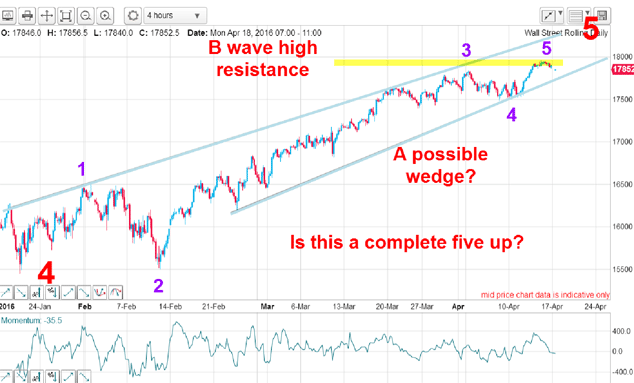
The market has rallied strongly in wave 3 and is testing the resistance at the B wave high, which is typical. But the pattern shows that there are five waves with my fifth wave at a new high for the move. That means that the market can turn down at any time from here (or it may continue to sub-divide higher, of course).
There is one pattern I like to see when considering when a fifth wave is ready to turn. That is, a complete five sub-waves within that fifth wave. Here is the hourly:
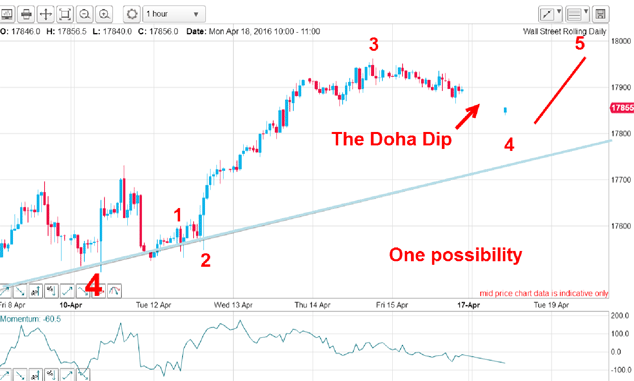
On this scale, I have a good wave 1, 2 and 3 marked and with this morning's "Doha dip", we are in wave 4 prior to making an assault on the final new high in wave 5.
I call it the Doha Dip because of the negative reaction to the oil talks that took place there on the weekend. Incidentally, I do not place great store in what is reported from such gatherings. We are told what they want us to know. Behind the scenes, there will be deals within deals that may only come to light well into the future.
What is important for a trader is the state of sentiment and the market's reaction.
Under this scenario, I am looking for a wave 4 low within the next couple of days and then a move to new highs which may break the resistance of the wave 4 highs in the 18,000 area.
If that does occur, my initial bullish scenario will come to the fore as my most favoured with the prospect of new highs above the May 2015 18,360 high.
But a break of the lower 'wedge' line in the 17,750 area would dash hopes for a shallow Doha dip and this would be my alternative best guess for wave structure:
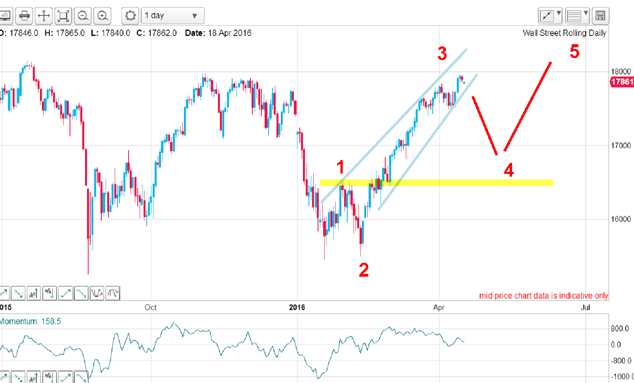
Wave 4 would decline by up to 1,400 points before turning up in wave 5. If the market declined below the yellow band, the outlook would be for further declines, because under Elliott's rules wave 4 cannot overlap in the region of the wave 1 extreme.
The bottom line is that I have more than one viable best guess scenario in play and that means I will tread very carefully until the fog clears.
Unless you have one option that stands out above all others, you are better off trading light or not at all.
John is is a British-born lapsed PhD physicist, who previously worked for Nasa on the Mars exploration team. He is a former commodity trading advisor with the US Commodities Futures Trading Commission, and worked in a boutique futures house in California in the 1980s.
He was a partner in one of the first futures newsletter advisory services, based in Washington DC, specialising in pork bellies and currencies. John is primarily a chart-reading trader, having cut his trading teeth in the days before PCs.
As well as his work in the financial world, he has launched, run and sold several 'real' businesses producing 'real' products.
-
 The industry at the heart of global technology
The semiconductor industry powers key trends such as artificial intelligence, says Rupert Hargreaves
By Rupert Hargreaves Published
-
 What are shareholder voting rights and why do they matter?
If you hold shares in a company, the chances are they’ll come with voting rights. But how do you exercise your right to vote? And is your fund manager taking it seriously?
By Katie Williams Published